
Ocean Freight Rates & Capacity
Trans-Pacific spot rates rise as U.S. import demand supports pricing
· Source: Drewry Supply Chain Advisors
Drewry's World Container Index increased 2% to $4,585 per 40-foot container on October 22. Shanghai-to-Los Angeles rose 2% to $8,007 and Shanghai-to-New York increased 1% to $10,166 as U.S. import demand supported rates, even with more effective capacity scheduled for the following week.
Summary and practical context by RoadHouse Recruiting · Reviewed
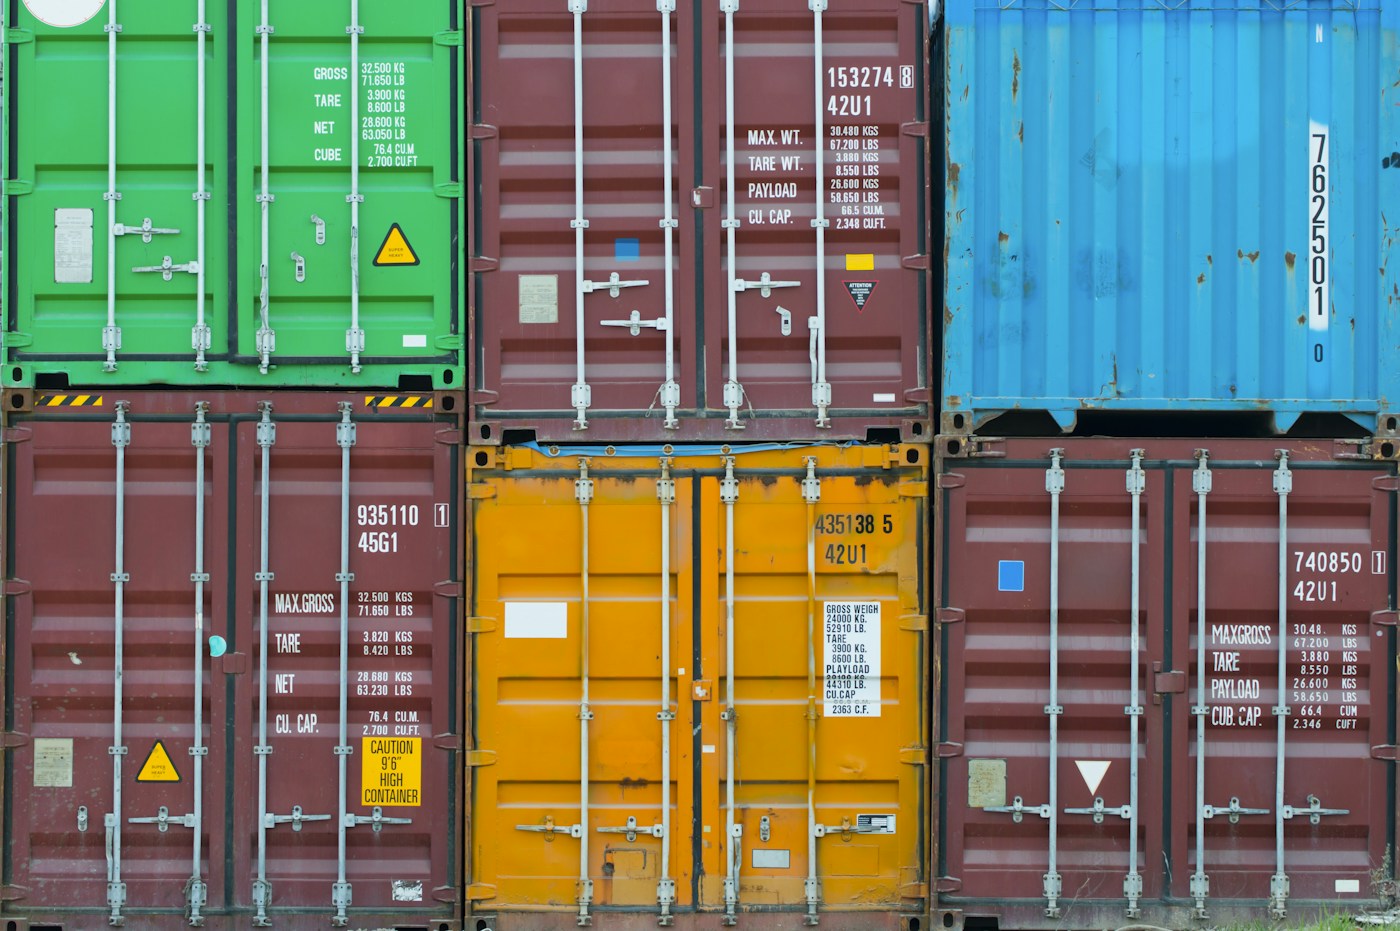
U.S. import lanes moved higher for a second week
The composite index reached its highest level in 15 weeks. Drewry attributed the increase to Trans-Pacific and Asia-Europe pricing. The Los Angeles and New York assessments are spot-market benchmarks for a 40-foot container, not guaranteed door-to-door quotes; origin charges, destination handling, inland transport, equipment and contractual terms can materially change the shipper's total cost.
More sailings do not automatically mean lower rates
Drewry counted two announced Trans-Pacific blank sailings for the next week, down from six in the current week, which implies more effective capacity. It nevertheless expected rates to remain stable because of U.S. import demand. That balance can change quickly if carriers revise schedules, demand softens or congestion moves between ports.
Regional network conditions remain uneven
Shanghai-to-Rotterdam increased 3% to $3,632 and Shanghai-to-Genoa rose 5% to $4,152 as Asia-Europe cancellations increased. Shanghai vessel waiting time reportedly fell from 97 hours in Week 38 to 38 hours in Week 42. Suez transits edged up from 54 to 55, while Persian Gulf security conditions continued to limit containership movements.
Understanding the update
This is Drewry's weekly spot-rate assessment dated October 22 and independent interpretation by FreightWaves. It is an ocean-freight benchmark, not the DAT truckload rate snapshot and not a prediction guarantee. The figures do not include every surcharge, contract rate, inland leg or port pair.
What it means for drivers and carriers
Importers should refresh landed-cost models and compare West Coast, East Coast and intermodal options using current allocation, blank-sailing and inland assumptions. A small weekly index increase can still produce a large budget effect on high-volume programs.
Questions to consider
- Will stronger effective capacity offset import demand after the next sailing cycle?
- How much of each quote is base ocean rate versus surcharge and inland cost?
- Do improved Asian port waits translate into better end-to-end schedule reliability?
Read the original reporting
This page provides an original summary and practical commentary. The linked source contains the full reporting. Older stories reflect information available on their published dates.
Read the source at Drewry Supply Chain Advisors ↗ (opens in a new tab)