
Rail freight, pricing & network performance
CN freight revenue rises 15% as pricing and mix outpace nearly flat carloads
· Source: Canadian National / FreightWaves
Canadian National reported C$4.57 billion in third-quarter freight revenue, up 15%, while total carloads were nearly unchanged and revenue ton-miles increased 4%. Freight revenue per revenue ton-mile rose 10%, but higher fuel expense and an C$117 million technology impairment pressured the reported operating ratio.
Summary and practical context by RoadHouse Recruiting · Reviewed
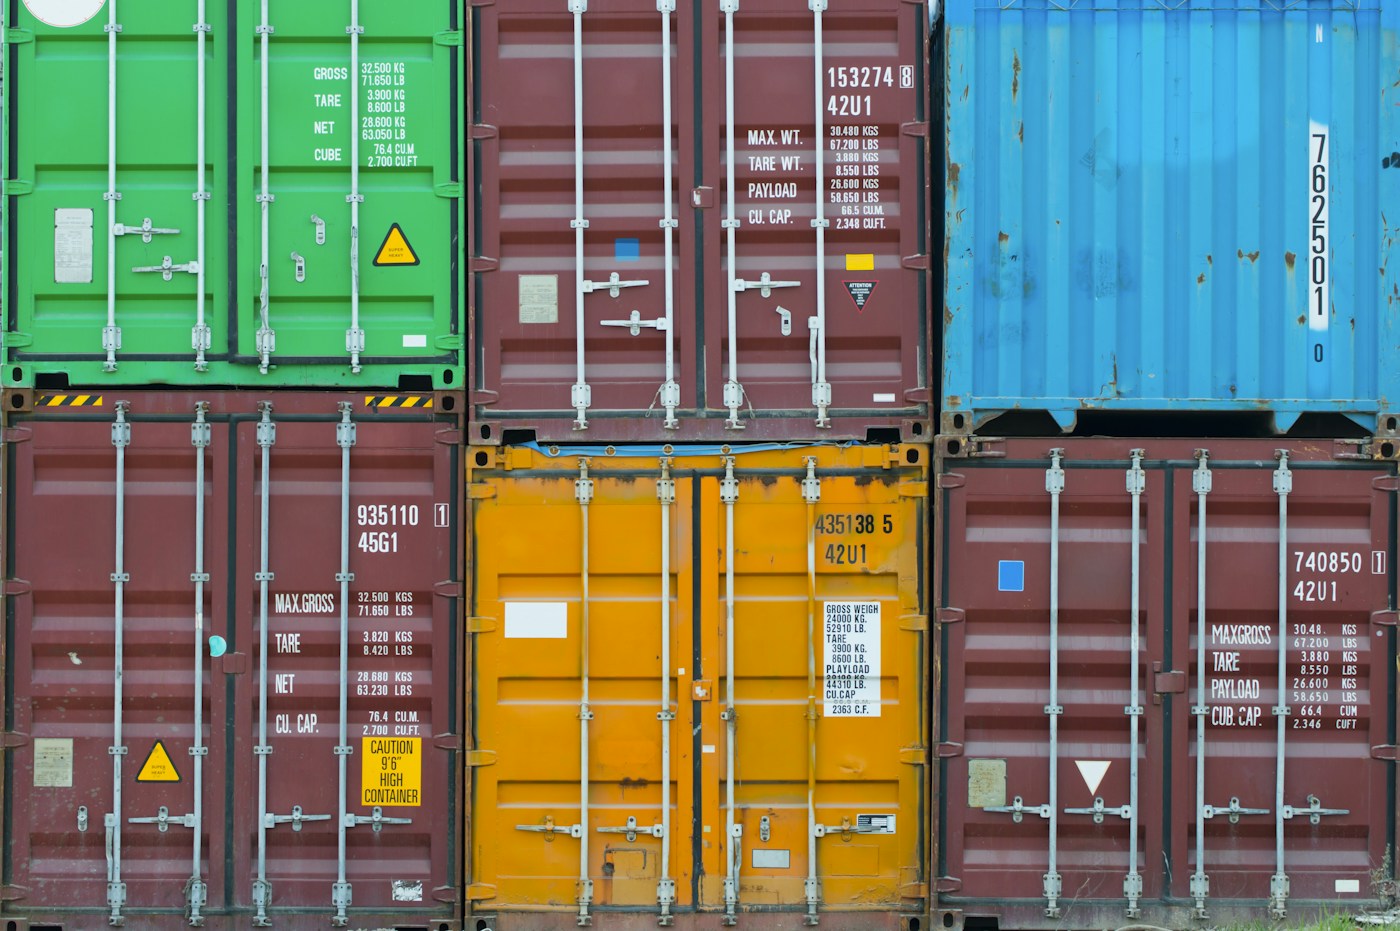
Revenue grew faster than physical volume
CN reported C$4.77 billion in total revenue and C$4.57 billion in freight revenue, each up 15% year over year. Revenue ton-miles increased 4% and carloads declined slightly to 1.364 million, while freight revenue per revenue ton-mile increased 10% and revenue per carload rose 15%. Pricing, fuel surcharges and mix therefore explain more of the revenue gain than a broad shipment surge.
Grain, energy and automotive led the quarter
Grain and fertilizer revenue rose 19%, petroleum and chemicals increased 17%, and automotive revenue gained 31%. Revenue ton-miles increased 12% for grain and fertilizer and 20% for automotive, offsetting declines in coal, forest products and intermodal. Networkwide growth should not be read as equal strength in every commodity or corridor.
Fuel and a technology write-down changed the margin picture
Operating expenses increased 19%, including a large rise in fuel expense. CN also recorded an approximately C$117 million impairment after discontinuing parts of dispatching and back-office technology projects. The reported operating ratio worsened to 63.7% from 61.4%, while the adjusted ratio excluding specified items improved to 61.0%; adjusted results are management measures, not the same as GAAP performance.
The outlook remains a forecast
CN maintained its 2026 expectation for low-single-digit revenue-ton-mile growth and mid-to-high-single-digit adjusted earnings-per-share growth, with earnings tracking toward the upper end. Trade conditions, fuel and commodity demand can still change the result.
What intermodal and rail customers should do
RoadHouse perspective: compare lane-level train schedules, terminal performance, drayage, fuel formulas and accessorials rather than treating the 15% revenue increase as a uniform rate or demand signal. Shippers using CN technology integrations should also confirm whether discontinued internal projects affect any customer-facing workflow.
Understanding the update
CN's October 30 release provides the primary Canadian-dollar financial and operating data. FreightWaves independently examined commodity growth, fuel expense and the technology impairment. Currency conversions in outside coverage can vary, so this article uses CN's reported Canadian-dollar figures.
What it means for drivers and carriers
CN generated much more revenue from modest physical growth, but the gain reflects pricing, fuel and mix as well as demand; intermodal customers still need lane-level service and total-cost evidence.
Questions to consider
- How much of the lane's price change is base rate, fuel or accessorial cost?
- Are terminal dwell, train velocity and drayage capacity improving on the routes used?
- Does the technology impairment affect any customer-facing system or planned integration?
Read the original reporting
This page provides an original summary and practical commentary. The linked source contains the full reporting. Older stories reflect information available on their published dates.
Read the source at Canadian National / FreightWaves ↗ (opens in a new tab)